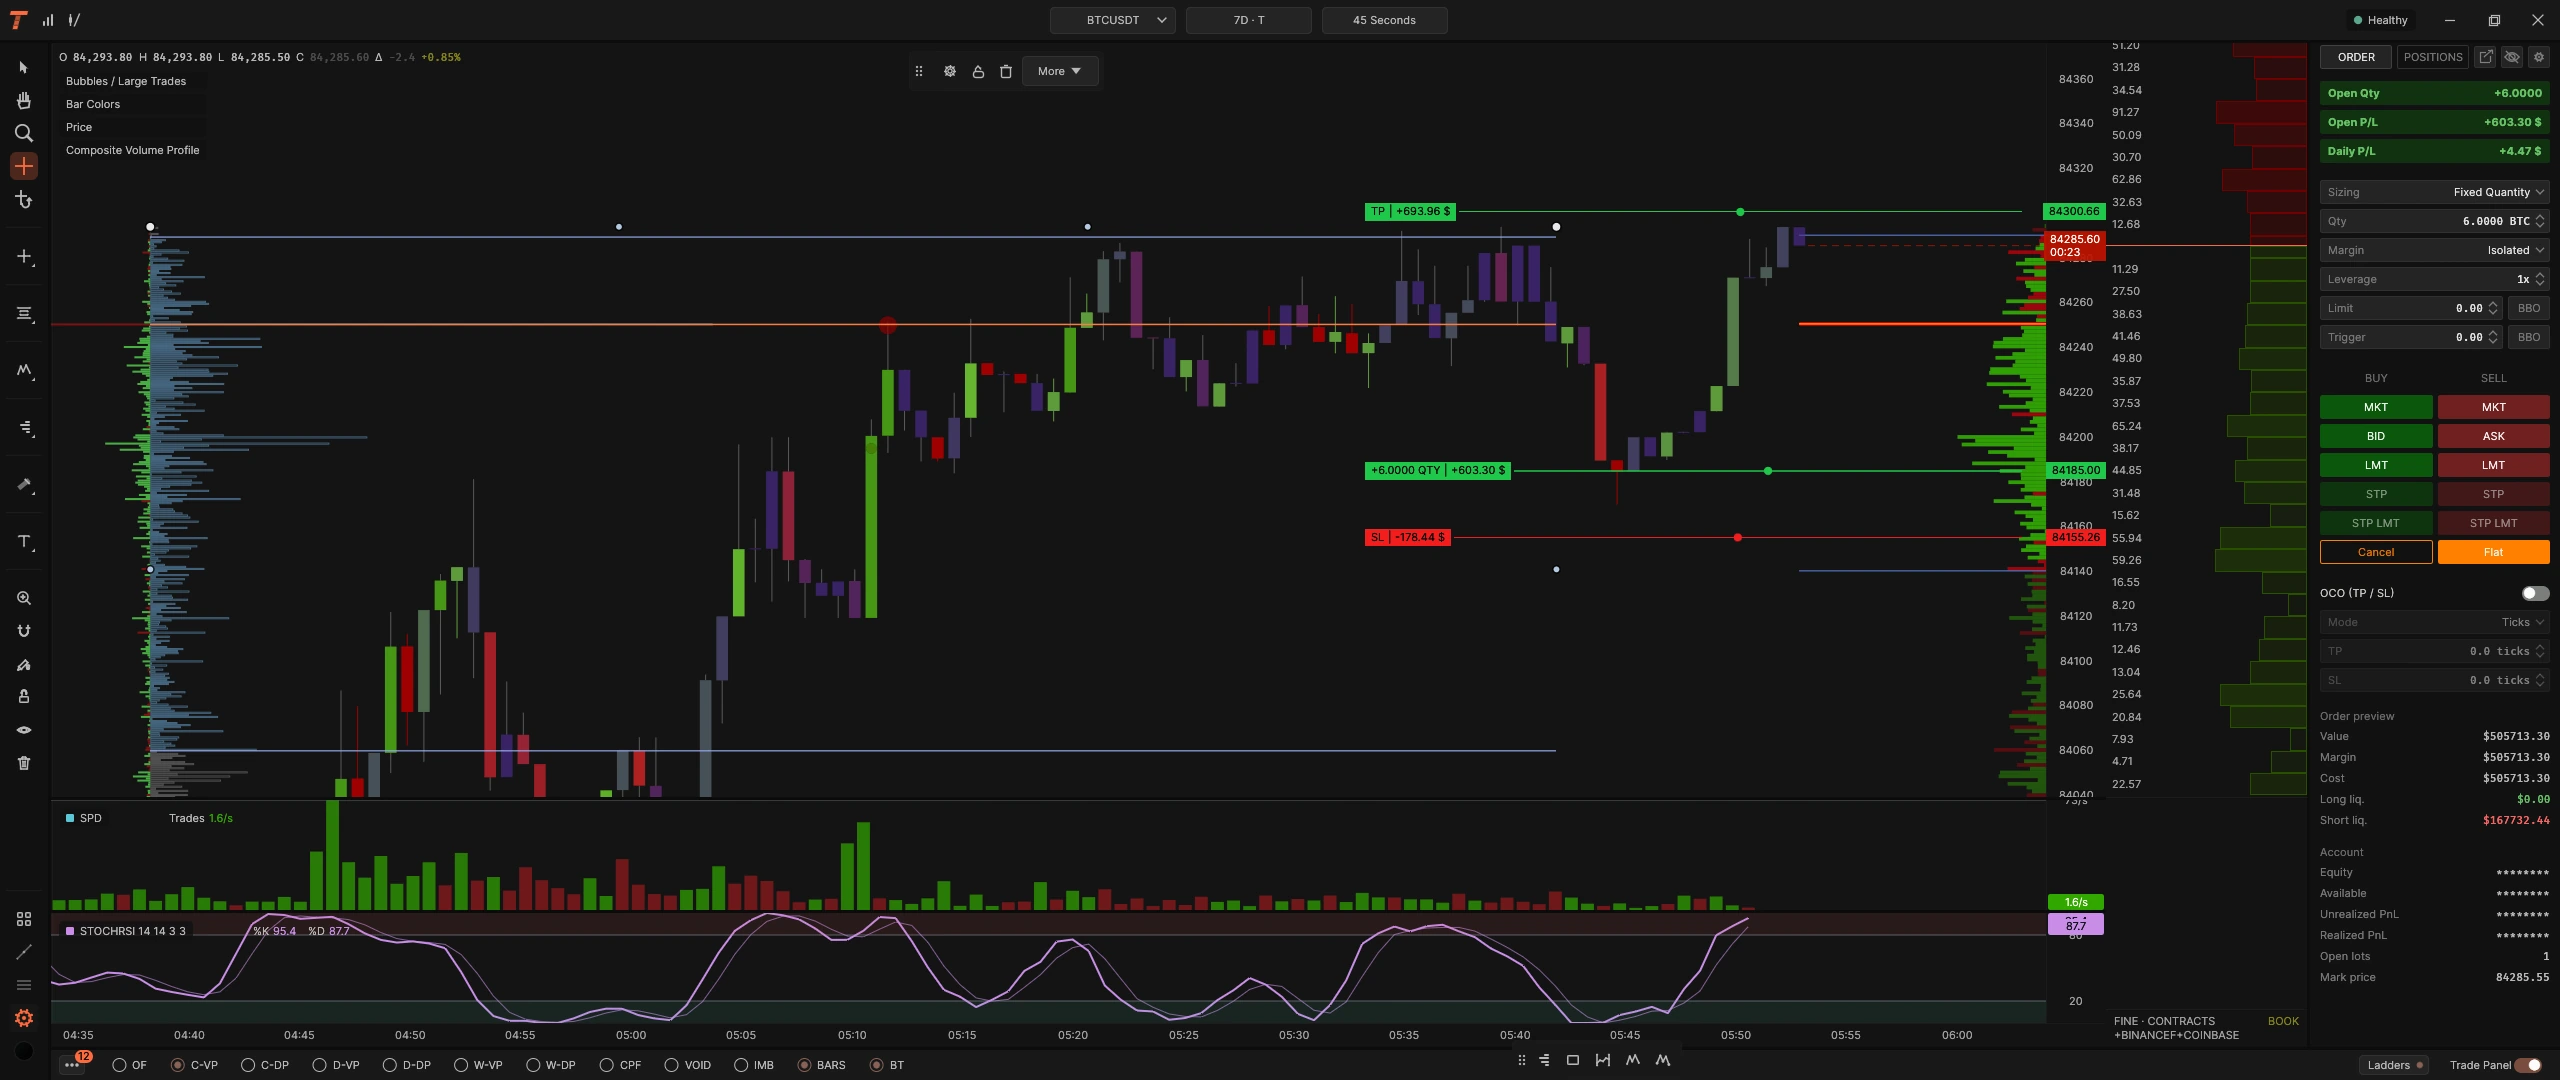
The terminal
What is actually in it, in the order you would meet it.
- 01
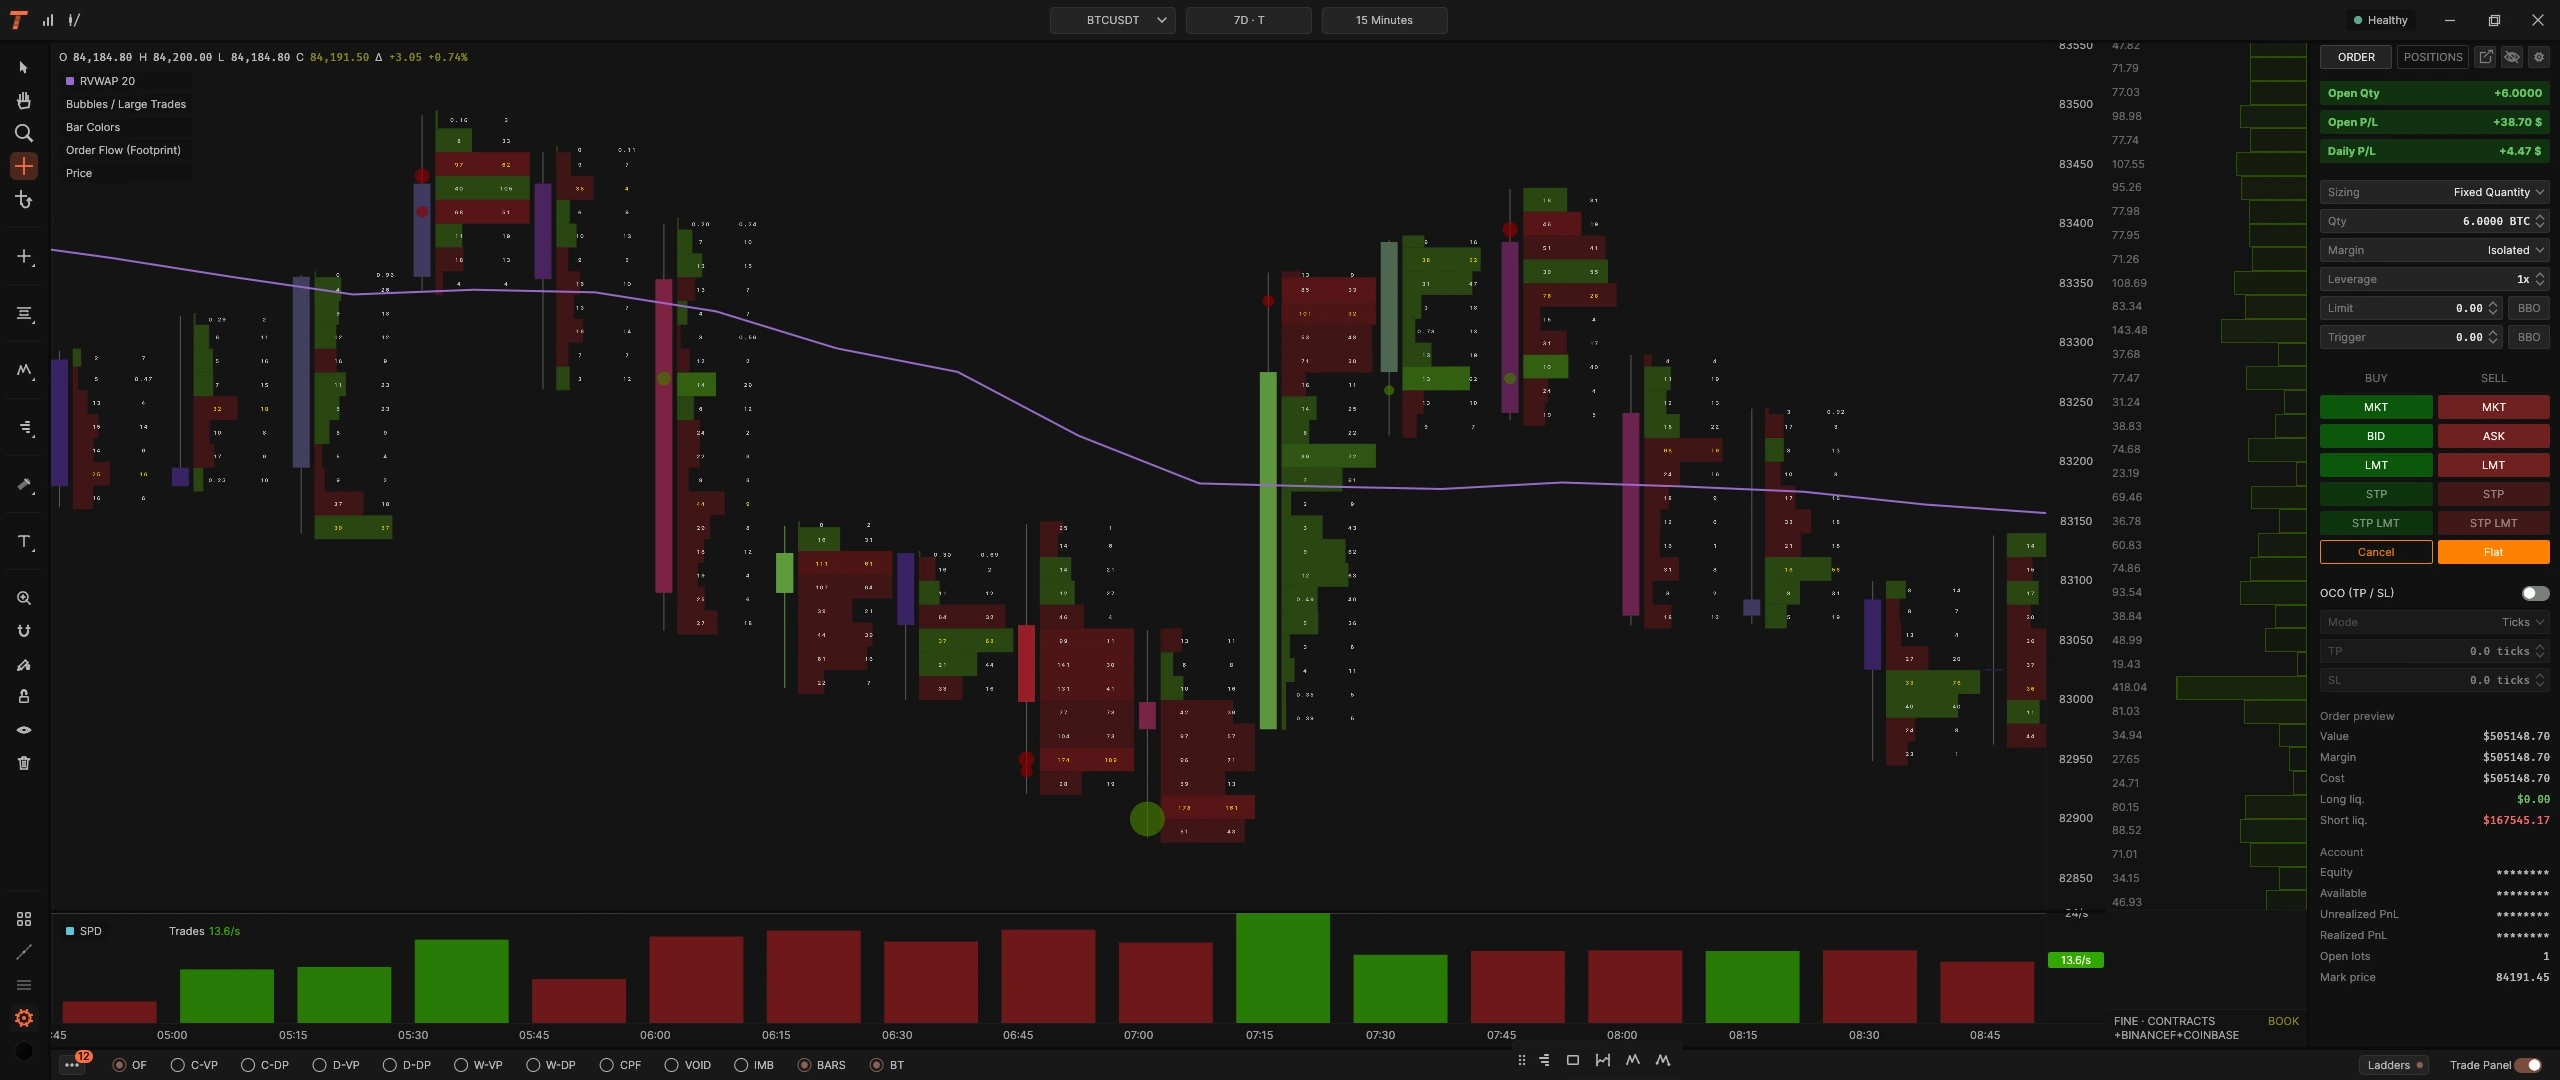
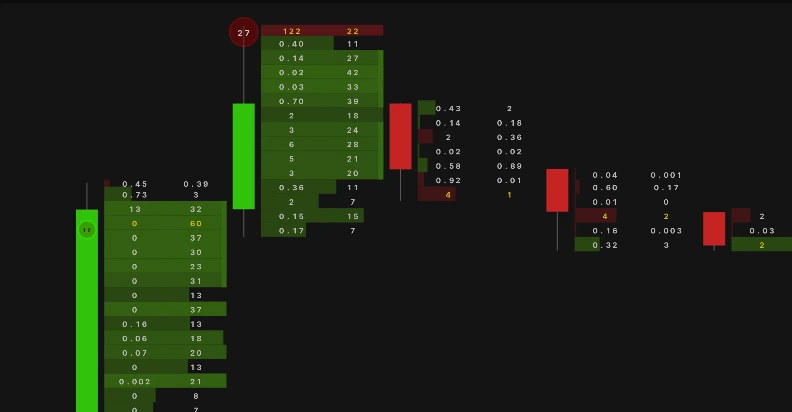
The footprint, and the imbalance rule
Every bar shows what traded at each price and on which side. Stacked imbalances are marked where the rule you set is met. The rule is a setting because a zero on one side always technically qualifies, and a mark that means nothing is worse than no mark.
- 02
The resting book, over time
The liquidity heatmap draws the book behind price as it actually stood, frame by frame, from captured depth. It is the only layer that asks the backend for depth history, which is why it is off until you ask for it. A chart that arrived with it on would start every session downloading segments nobody wanted.
- 03
Where price fell through nothing
Liquidity voids mark the ranges the resting book barely covered. Imbalance zones mark the shelves price walked through. The absorption map shows where aggression was held and where it broke.
- 04
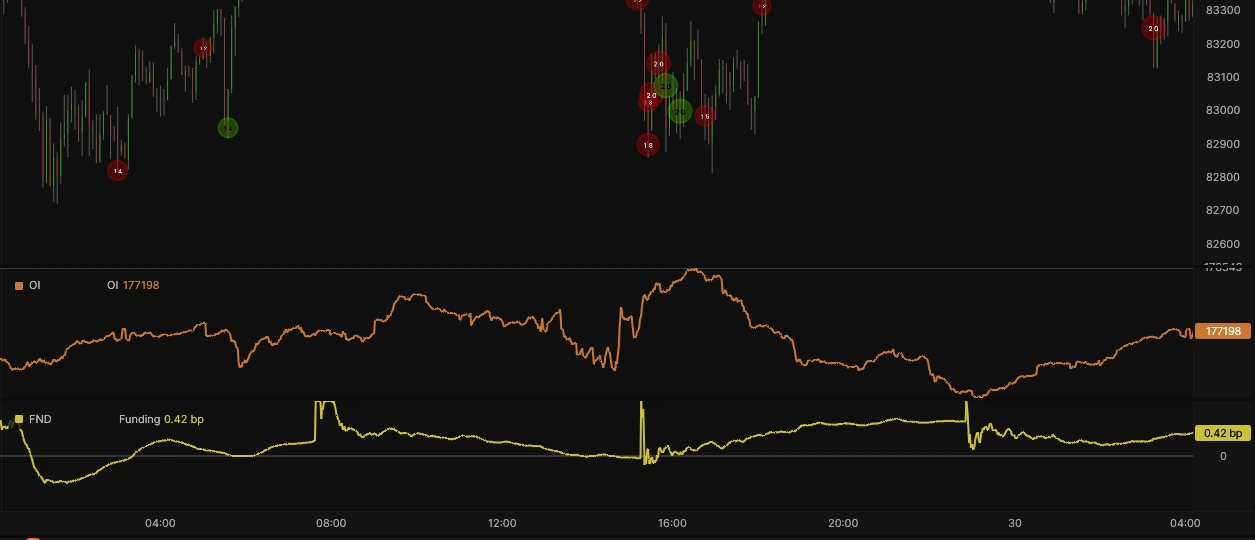
44 panels, one time axis
Each analysis panel is a genuinely separate region with its own GPU pass and its own value scale, not a fixed-fraction band stacked inside the price canvas pretending to be one.
- 05
Execution, and the confirmation you can turn off
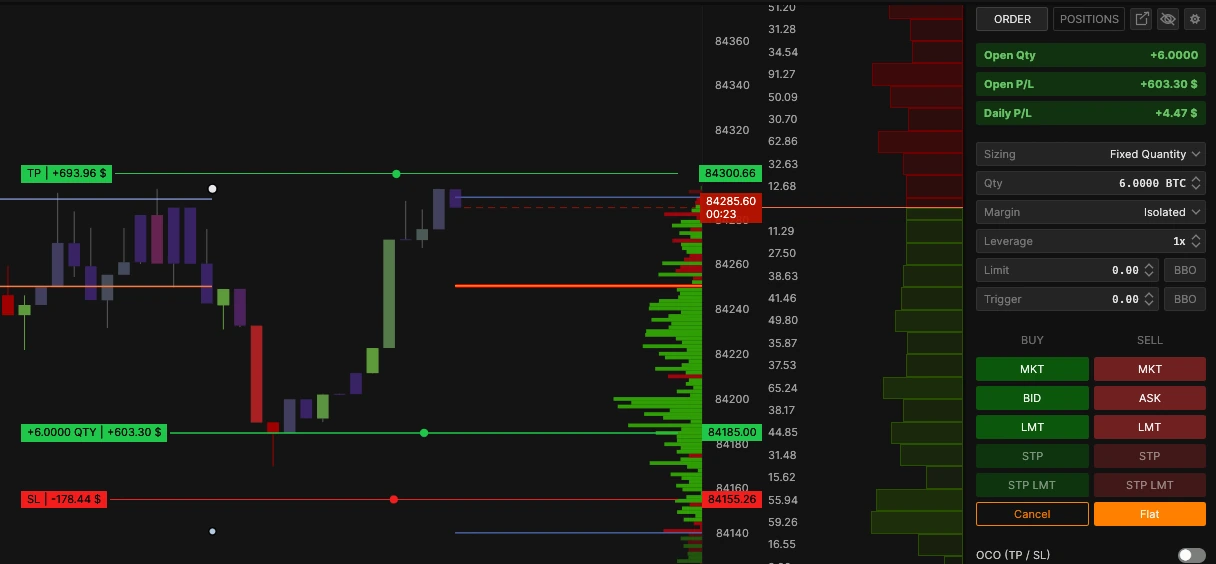
Trading lines on the chart, drag to move a stop, right-click to cancel. Live orders can require a confirmation dialog; cancelling never does, because making "get me out of this" wait on a dialog is its own hazard.
- 06
Your workspace, saved and synced
Layouts, charts, templates and window geometry persist, and sync to your account so a second machine opens where the first left off. They stay reachable even without a current licence: your saved work is yours.